
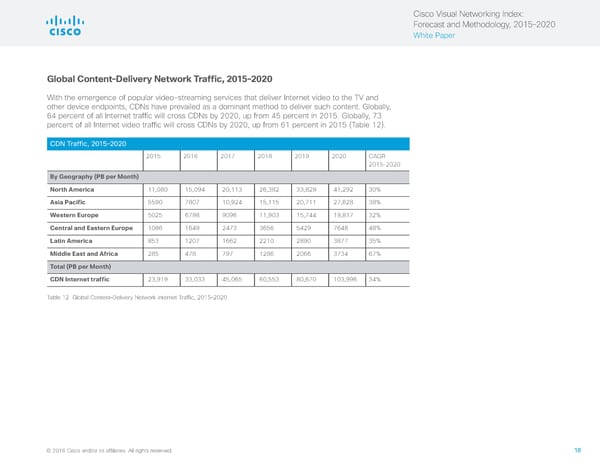
Cisco Visual Networking Index: Forecast and Methodology, 2015–2020 White Paper Global Content–Delivery Network Traffic, 2015–2020 With the emergence of popular video-streaming services that deliver Internet video to the TV and other device endpoints, CDNs have prevailed as a dominant method to deliver such content. Globally, 64 percent of all Internet traffic will cross CDNs by 2020, up from 45 percent in 2015. Globally, 73 percent of all Internet video traffic will cross CDNs by 2020, up from 61 percent in 2015 (Table 12). CDN Traffic, 2015–2020 2015 2016 2017 2018 2019 2020 CAGR 2015–2020 By Geography (PB per Month) North America 11,080 15,094 20,113 26,382 33,829 41,292 30% Asia Pacific 5590 7807 10,924 15,115 20,711 27,628 38% Western Europe 5025 6798 9096 11,903 15,744 19,817 32% Central and Eastern Europe 1086 1649 2473 3656 5429 7648 48% Latin America 853 1207 1662 2210 2890 3877 35% Middle East and Africa 285 478 797 1286 2066 3734 67% Total (PB per Month) CDN Internet traffic 23,919 33,033 45,065 60,553 80,670 103,996 34% Table 12 Global Content–Delivery Network Internet Traffic, 2015–2020 © 2016 Cisco and/or its affiliates. All rights reserved. 18
 Visual Networking Index - Forecasting & Methodology Page 17 Page 19