
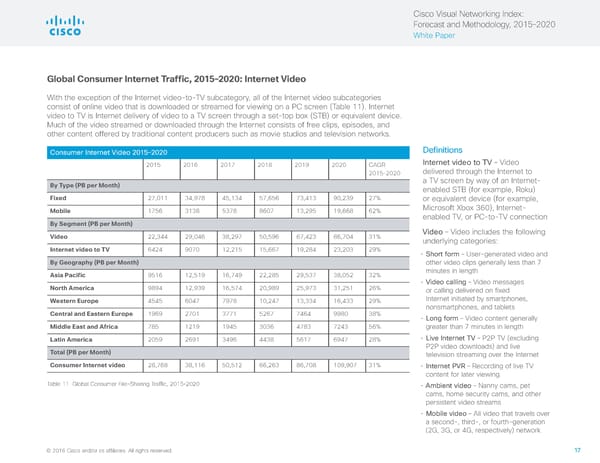
Cisco Visual Networking Index: Forecast and Methodology, 2015–2020 White Paper Global Consumer Internet Traffic, 2015–2020: Internet Video With the exception of the Internet video-to-TV subcategory, all of the Internet video subcategories consist of online video that is downloaded or streamed for viewing on a PC screen (Table 11). Internet video to TV is Internet delivery of video to a TV screen through a set-top box (STB) or equivalent device. Much of the video streamed or downloaded through the Internet consists of free clips, episodes, and other content offered by traditional content producers such as movie studios and television networks. Consumer Internet Video 2015–2020 Definitions 2015 2016 2017 2018 2019 2020 CAGR Internet video to TV – Video 2015–2020 delivered through the Internet to By Type (PB per Month) a TV screen by way of an Internet- enabled STB (for example, Roku) Fixed 27,011 34,978 45,134 57,656 73,413 90,239 27% or equivalent device (for example, Mobile 1756 3138 5378 8607 13,295 19,668 62% Microsoft Xbox 360), Internet- enabled TV, or PC-to-TV connection By Segment (PB per Month) Video 22,344 29,046 38,297 50,596 67,423 86,704 31% Video – Video includes the following underlying categories: Internet video to TV 6424 9070 12,215 15,667 19,284 23,203 29% • Short form – User-generated video and By Geography (PB per Month) other video clips generally less than 7 Asia Pacific 9516 12,519 16,749 22,285 29,537 38,052 32% minutes in length North America 9894 12,939 16,574 20,989 25,973 31,251 26% • Video calling – Video messages or calling delivered on fixed Western Europe 4545 6047 7978 10,247 13,334 16,433 29% Internet initiated by smartphones, nonsmartphones, and tablets Central and Eastern Europe 1969 2701 3771 5267 7464 9980 38% • Long form – Video content generally Middle East and Africa 785 1219 1945 3036 4783 7243 56% greater than 7 minutes in length Latin America 2059 2691 3496 4438 5617 6947 28% • Live Internet TV – P2P TV (excluding P2P video downloads) and live Total (PB per Month) television streaming over the Internet Consumer Internet video 28,768 38,116 50,512 66,263 86,708 109,907 31% • Internet PVR – Recording of live TV content for later viewing Table 11 Global Consumer File-Sharing Traffic, 2015–2020 • Ambient video – Nanny cams, pet cams, home security cams, and other persistent video streams • Mobile video – All video that travels over a second-, third-, or fourth-generation (2G, 3G, or 4G, respectively) network © 2016 Cisco and/or its affiliates. All rights reserved. 17
 Visual Networking Index - Forecasting & Methodology Page 16 Page 18