
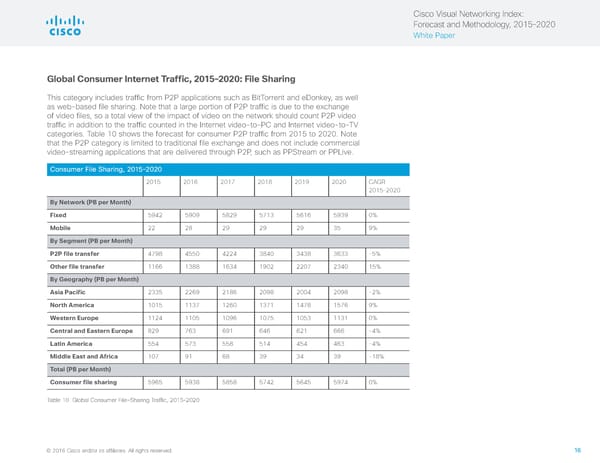
Cisco Visual Networking Index: Forecast and Methodology, 2015–2020 White Paper Global Consumer Internet Traffic, 2015–2020: File Sharing This category includes traffic from P2P applications such as BitTorrent and eDonkey, as well as web-based file sharing. Note that a large portion of P2P traffic is due to the exchange of video files, so a total view of the impact of video on the network should count P2P video traffic in addition to the traffic counted in the Internet video-to-PC and Internet video-to-TV categories. Table 10 shows the forecast for consumer P2P traffic from 2015 to 2020. Note that the P2P category is limited to traditional file exchange and does not include commercial video-streaming applications that are delivered through P2P, such as PPStream or PPLive. Consumer File Sharing, 2015–2020 2015 2016 2017 2018 2019 2020 CAGR 2015–2020 By Network (PB per Month) Fixed 5942 5909 5829 5713 5616 5939 0% Mobile 22 28 29 29 29 35 9% By Segment (PB per Month) P2P file transfer 4798 4550 4224 3840 3438 3633 -5% Other file transfer 1166 1388 1634 1902 2207 2340 15% By Geography (PB per Month) Asia Pacific 2335 2269 2186 2098 2004 2098 -2% North America 1015 1137 1260 1371 1478 1576 9% Western Europe 1124 1105 1096 1075 1053 1131 0% Central and Eastern Europe 829 763 691 646 621 666 -4% Latin America 554 573 558 514 454 463 -4% Middle East and Africa 107 91 68 39 34 39 -18% Total (PB per Month) Consumer file sharing 5965 5938 5858 5742 5645 5974 0% Table 10 Global Consumer File-Sharing Traffic, 2015–2020 © 2016 Cisco and/or its affiliates. All rights reserved. 16
 Visual Networking Index - Forecasting & Methodology Page 15 Page 17