
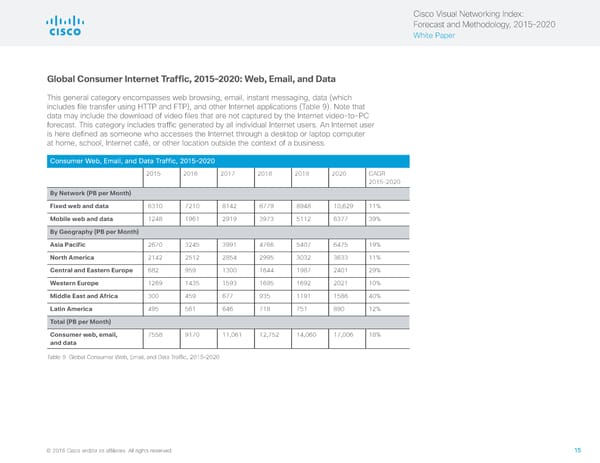
Cisco Visual Networking Index: Forecast and Methodology, 2015–2020 White Paper Global Consumer Internet Traffic, 2015–2020: Web, Email, and Data This general category encompasses web browsing, email, instant messaging, data (which includes file transfer using HTTP and FTP), and other Internet applications (Table 9). Note that data may include the download of video files that are not captured by the Internet video-to-PC forecast. This category includes traffic generated by all individual Internet users. An Internet user is here defined as someone who accesses the Internet through a desktop or laptop computer at home, school, Internet café, or other location outside the context of a business. Consumer Web, Email, and Data Traffic, 2015–2020 2015 2016 2017 2018 2019 2020 CAGR 2015–2020 By Network (PB per Month) Fixed web and data 6310 7210 8142 8779 8948 10,629 11% Mobile web and data 1248 1961 2919 3973 5112 6377 39% By Geography (PB per Month) Asia Pacific 2670 3245 3991 4766 5407 6475 19% North America 2142 2512 2854 2995 3032 3633 11% Central and Eastern Europe 682 959 1300 1644 1987 2401 29% Western Europe 1269 1435 1593 1695 1692 2021 10% Middle East and Africa 300 459 677 935 1191 1586 40% Latin America 495 561 646 718 751 890 12% Total (PB per Month) Consumer web, email, 7558 9170 11,061 12,752 14,060 17,006 18% and data Table 9 Global Consumer Web, Email, and Data Traffic, 2015–2020 © 2016 Cisco and/or its affiliates. All rights reserved. 15
 Visual Networking Index - Forecasting & Methodology Page 14 Page 16