
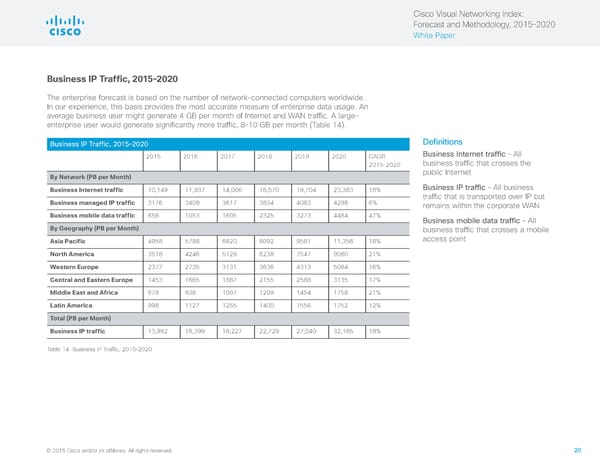
Cisco Visual Networking Index: Forecast and Methodology, 2015–2020 White Paper Business IP Traffic, 2015–2020 The enterprise forecast is based on the number of network-connected computers worldwide. In our experience, this basis provides the most accurate measure of enterprise data usage. An average business user might generate 4 GB per month of Internet and WAN traffic. A large- enterprise user would generate significantly more traffic, 8–10 GB per month (Table 14). Business IP Traffic, 2015–2020 Definitions 2015 2016 2017 2018 2019 2020 CAGR Business Internet traffic – All 2015–2020 business traffic that crosses the By Network (PB per Month) public Internet Business Internet traffic 10,149 11,937 14,006 16,570 19,704 23,383 18% Business IP traffic – All business traffic that is transported over IP but Business managed IP traffic 3176 3409 3617 3834 4063 4298 6% remains within the corporate WAN Business mobile data traffic 658 1053 1605 2325 3273 4484 47% Business mobile data traffic – All By Geography (PB per Month) business traffic that crosses a mobile Asia Pacific 4958 5788 6820 8092 9581 11,356 18% access point North America 3518 4246 5129 6238 7547 9080 21% Western Europe 2377 2735 3131 3636 4313 5084 16% Central and Eastern Europe 1453 1665 1887 2155 2588 3135 17% Middle East and Africa 678 838 1007 1209 1454 1758 21% Latin America 998 1127 1255 1400 1556 1752 12% Total (PB per Month) Business IP traffic 13,982 16,399 19,227 22,729 27,040 32,165 18% Table 14 Business IP Traffic, 2015–2020 © 2015 Cisco and/or its affiliates. All rights reserved. 20
 Visual Networking Index - Forecasting & Methodology Page 19 Page 21