
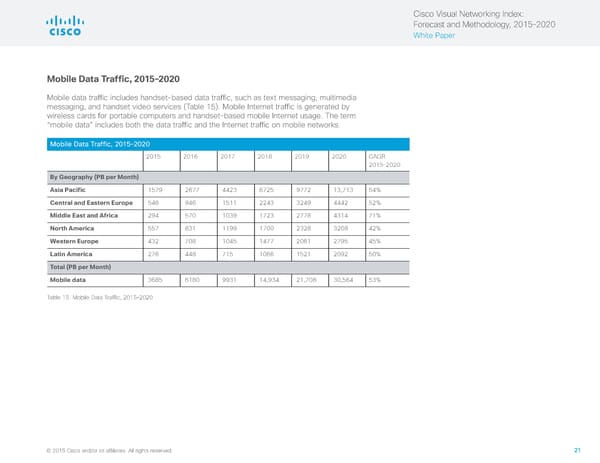
Cisco Visual Networking Index: Forecast and Methodology, 2015–2020 White Paper Mobile Data Traffic, 2015–2020 Mobile data traffic includes handset-based data traffic, such as text messaging, multimedia messaging, and handset video services (Table 15). Mobile Internet traffic is generated by wireless cards for portable computers and handset-based mobile Internet usage. The term “mobile data” includes both the data traffic and the Internet traffic on mobile networks. Mobile Data Traffic, 2015–2020 2015 2016 2017 2018 2019 2020 CAGR 2015–2020 By Geography (PB per Month) Asia Pacific 1579 2677 4423 6725 9772 13,713 54% Central and Eastern Europe 546 946 1511 2243 3249 4442 52% Middle East and Africa 294 570 1039 1723 2778 4314 71% North America 557 831 1199 1700 2328 3208 42% Western Europe 432 708 1045 1477 2061 2795 45% Latin America 276 448 715 1066 1521 2092 50% Total (PB per Month) Mobile data 3685 6180 9931 14,934 21,708 30,564 53% Table 15 Mobile Data Traffic, 2015–2020 © 2015 Cisco and/or its affiliates. All rights reserved. 21
 Visual Networking Index - Forecasting & Methodology Page 20 Page 22