
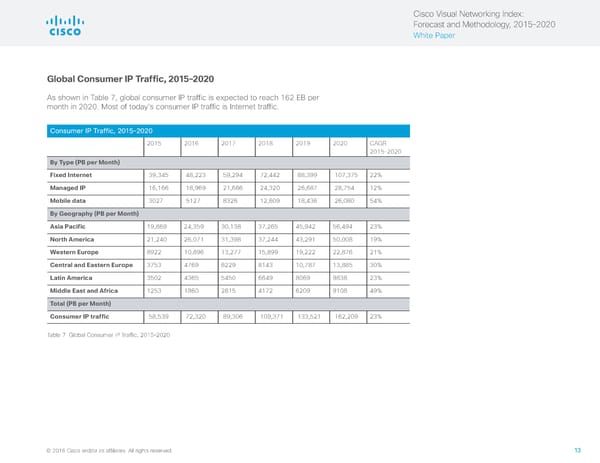
Cisco Visual Networking Index: Forecast and Methodology, 2015–2020 White Paper Global Consumer IP Traffic, 2015–2020 As shown in Table 7, global consumer IP traffic is expected to reach 162 EB per month in 2020. Most of today’s consumer IP traffic is Internet traffic. Consumer IP Traffic, 2015–2020 2015 2016 2017 2018 2019 2020 CAGR 2015–2020 By Type (PB per Month) Fixed Internet 39,345 48,223 59,294 72,442 88,399 107,375 22% Managed IP 16,166 18,969 21,686 24,320 26,687 28,754 12% Mobile data 3027 5127 8326 12,609 18,436 26,080 54% By Geography (PB per Month) Asia Pacific 19,869 24,359 30,138 37,265 45,942 56,494 23% North America 21,240 26,071 31,398 37,244 43,291 50,008 19% Western Europe 8922 10,896 13,277 15,899 19,222 22,876 21% Central and Eastern Europe 3753 4769 6229 8143 10,787 13,885 30% Latin America 3502 4365 5450 6649 8069 9838 23% Middle East and Africa 1253 1860 2815 4172 6209 9108 49% Total (PB per Month) Consumer IP traffic 58,539 72,320 89,306 109,371 133,521 162,209 23% Table 7 Global Consumer IP Traffic, 2015–2020 © 2016 Cisco and/or its affiliates. All rights reserved. 13
 Visual Networking Index - Forecasting & Methodology Page 12 Page 14