
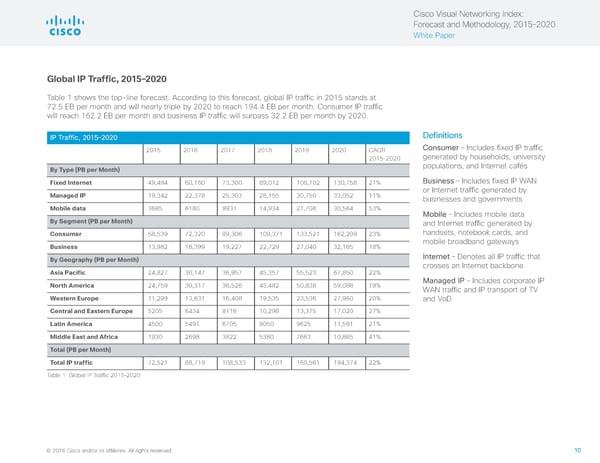
Cisco Visual Networking Index: Forecast and Methodology, 2015–2020 White Paper Global IP Traffic, 2015–2020 Table 1 shows the top-line forecast. According to this forecast, global IP traffic in 2015 stands at 72.5 EB per month and will nearly triple by 2020 to reach 194.4 EB per month. Consumer IP traffic will reach 162.2 EB per month and business IP traffic will surpass 32.2 EB per month by 2020. IP Traffic, 2015–2020 Definitions 2015 2016 2017 2018 2019 2020 CAGR Consumer – Includes fixed IP traffic 2015–2020 generated by households, university By Type (PB per Month) populations, and Internet cafés Fixed Internet 49,494 60,160 73,300 89,012 108,102 130,758 21% Business – Includes fixed IP WAN Managed IP 19,342 22,378 25,303 28,155 30,750 33,052 11% or Internet traffic generated by businesses and governments Mobile data 3685 6180 9931 14,934 21,708 30,564 53% Mobile – Includes mobile data By Segment (PB per Month) and Internet traffic generated by Consumer 58,539 72,320 89,306 109,371 133,521 162,209 23% handsets, notebook cards, and Business 13,982 16,399 19,227 22,729 27,040 32,165 18% mobile broadband gateways By Geography (PB per Month) Internet – Denotes all IP traffic that crosses an Internet backbone Asia Pacific 24,827 30,147 36,957 45,357 55,523 67,850 22% North America 24,759 30,317 36,526 43,482 50,838 59,088 19% Managed IP – Includes corporate IP WAN traffic and IP transport of TV Western Europe 11,299 13,631 16,408 19,535 23,536 27,960 20% and VoD Central and Eastern Europe 5205 6434 8116 10,298 13,375 17,020 27% Latin America 4500 5491 6705 8050 9625 11,591 21% Middle East and Africa 1930 2698 3822 5380 7663 10,865 41% Total (PB per Month) Total IP traffic 72,521 88,719 108,533 132,101 160,561 194,374 22% Table 1 Global IP Traffic 2015–2020 © 2016 Cisco and/or its affiliates. All rights reserved. 10
 Visual Networking Index - Forecasting & Methodology Page 9 Page 11